Sarcomere Fluorescence Model
Model Parameters
Model Explanation
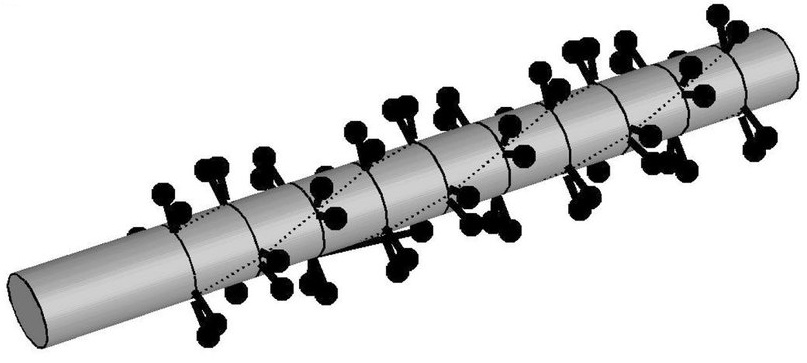
Model showing theoretical arrangement of myosin heads along thick filament.2 Three myosin heads appear as a "crown." Crowns appear in intervals of 14.3 nm. Three crowns constitute one "repeat." Each zone contains a variable number of repeats (e.g., P-zone contains two repeats for a total of six crowns, or eighteen myosin heads).
Model Profile and Measurements
Note: Sarcomere measurements (e.g., horizontal peak to peak distance, vertical peak to minima distance, etc.) are not calculated for all model profiles. Parameters set beyond accepted values (e.g., sarcomere lengths less than 2000 nm or greater than 2200 nm, bare zone lengths less than 140 nm or greater than 160 nm, etc.) may produce fluorescence profiles that do not resemeble that of a sarcomere, complicating the identification of peak and minima indices required for measurement calculations. When values outside of accepted ranges are used, the profile will still be generated and displayed, but no calculations will be performed. Similary, random redistribution of fluorescent tags that have been removed produces an unpredictable curve. Calculations will not be performed when this option is selection either.